HeatMaps are widely used to visualize matrix-formatted data by representing numerical values with color gradients.They are used in many fields to inspect overall patterns in data and are often combined with hierarchical clustering analysis(HCA)when relationships among samples or variables need to be examined visually.
BCC currently provides two HeatMap-related tools.Although both are based on HeatMap workflows,they are intended for different types of use.
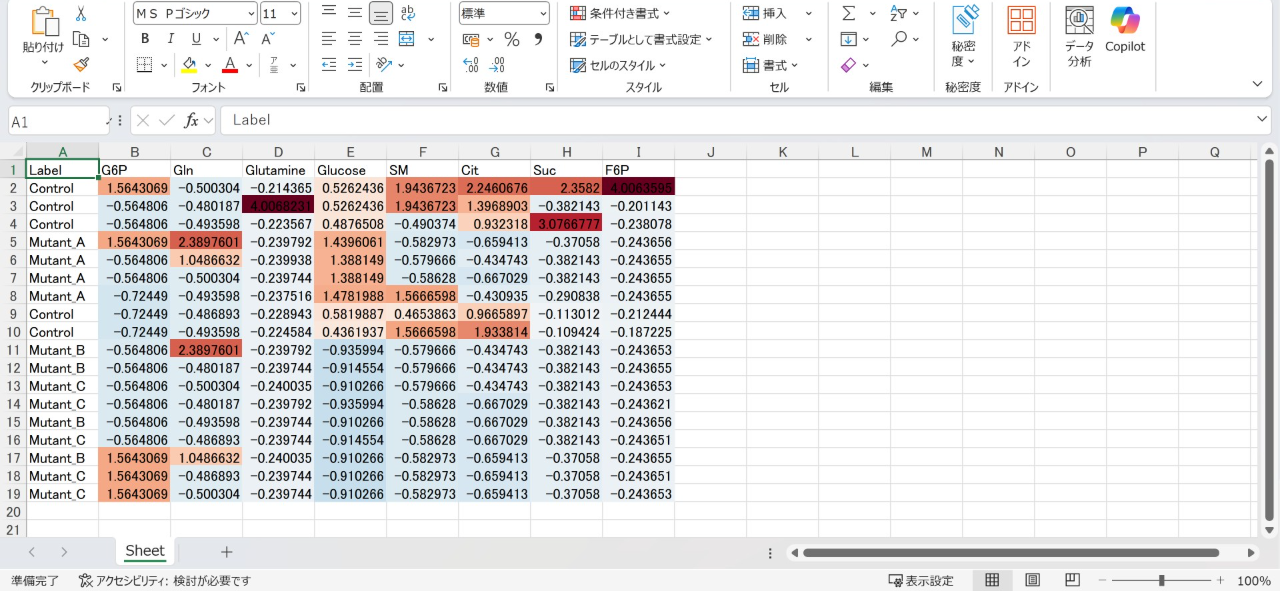
1.Simple HeatMap & HCA Calculation & Excel Exporter
This tool performs HeatMap generation together with hierarchical clustering and allows the resulting reordered matrix to be exported in Excel-compatible form.
It can be used when users want to generate a HeatMap from tabular data,inspect clustering-based row and column order,and export the result for later review or sharing.Because the reordered output can be exported directly,this tool may be useful in workflows where clustered tables need to be checked again outside the browser environment.
2.HeatMap & Cluster Analysis with Map
This tool is designed for cases in which clustering results are interpreted together with location-related information.It links HeatMap and clustering results to spatial or coordinate-based data so that clustered samples can also be viewed in a mapped context.
It can be used when users want to perform clustering on structured data,inspect the result as a HeatMap,and compare the cluster-related output with spatial distribution or sampling position.This may be relevant when the relationship between clustered data and location is part of the analysis.
Different Uses of the Two Tools
The first tool is oriented toward HeatMap generation,hierarchical clustering,and Excel-compatible export of reordered results.The second tool is oriented toward HeatMap and clustering workflows in which mapped or spatial interpretation is also needed.
In other words,the difference between them is not simply the output style.They support different use cases.One is more suitable for export and table-based reuse,while the other is more suitable for comparison with coordinate-linked information.
Potential Areas of Use
These tools may be useful in fields where matrix-like datasets are commonly inspected visually,including life sciences,analytical chemistry,environmental science,and other research areas that use tabular multivariate data.They may also be relevant in situations where users want browser-based tools for quick inspection of clustered results without installing separate desktop software.
Conclusion
BCC provides two HeatMap-related tools with different practical roles.One focuses on HeatMap generation,hierarchical clustering,and Excel-compatible export.The other focuses on HeatMap and clustering workflows that also incorporate mapped or spatial context.
Together,they provide browser-based options for users who want to inspect structured data visually and choose between export-oriented and map-oriented workflows depending on the purpose of the analysis.