How do you solve a Punnett square? Place each parent's possible gametes along the top and side of a grid, combine their alleles in every cell, and count the possible offspring genotypes. For the classic Aa × Aa cross, the genotype ratio is 1 AA : 2 Aa : 1 aa, or 25%, 50%, and 25%. If A is completely dominant over a, the phenotype ratio is 3 : 1.
This guide includes a free interactive Punnett square calculator, worked monohybrid and dihybrid examples, a three-choice practice quiz, and photographs from a Japanese biology textbook first published in 1914. You can learn the modern method and see how inheritance was taught more than a century ago.
What Is a Punnett Square?
A Punnett square is a grid for organizing possible combinations of alleles inherited from two parents. It predicts probabilities under the genetic assumptions of the cross; it does not guarantee outcomes for any particular child. A two-by-two square is often used for one gene with two alleles, while a four-by-four square can represent two independently assorting genes.
Free Punnett Square Calculator
Choose the parents' genotypes, select one gene or two independently assorting genes, and calculate possible offspring genotypes. The table and probabilities update without leaving the page.
Interactive Punnett Square Calculator
Punnett Square Practice Quiz
Answer 10 multiple-choice questions. Each question has exactly three choices and one correct answer. Results and explanations appear when you submit.
How to Make a Punnett Square in 4 Steps
- Write the parental genotypes. For example, Aa × Aa.
- List possible gametes. Each parent produces A and a gametes in equal proportions in this simple model.
- Fill the grid. Combine one allele from each parent in each box.
- Count outcomes. One AA, two Aa, and one aa give 25%, 50%, and 25%.
Punnett Square Examples: AA × aa, Aa × Aa, and Aa × aa
Example 1: AA × aa
Every offspring receives A from the first parent and a from the second. All predicted offspring are Aa (100%).
Example 2: Aa × Aa
| Gametes | A | a |
|---|---|---|
| A | AA | Aa |
| a | Aa | aa |
The genotype ratio is 1:2:1. Under complete dominance, the phenotype ratio is 3 dominant : 1 recessive.
Example 3: Aa × aa
The first parent can pass on A or a; the second can pass on only a. Predicted offspring are 50% Aa and 50% aa.
Genotype vs. Phenotype: Why 1:2:1 and 3:1 Are Different
Genotype describes the allele combination (AA, Aa, aa). Phenotype describes the observable trait. When A is completely dominant, both AA and Aa have the dominant phenotype, producing a 3:1 phenotype ratio in an Aa × Aa cross. This is a simplified single-gene model; many real traits involve incomplete dominance, codominance, environmental influences, or multiple genes.
Dihybrid Punnett Square: AaBb × AaBb
For two independently assorting genes, an AaBb parent makes four gamete types: AB, Ab, aB, and ab, each at 25%. A 4×4 Punnett square contains 16 equally likely combinations. With complete dominance at both loci and no gene interactions, the classic phenotype ratio is 9:3:3:1.
Try the two-gene mode in the calculator above to build the complete 4×4 grid. If genes are linked, gametes are not necessarily equally frequent, so the independent-assortment result may not apply.
How Were Punnett Squares Explained More Than 100 Years Ago?
To add historical context, we examined an original copy of Saibō to Iden (細胞と遺傳, Cells and Heredity) by Shigeo Yamauchi. The book was first published in 1914; the photographed copy is the seventh edition, printed in 1922. Its discussion of Mendelian inheritance includes both a 2×2 combination table and a 4×4 table for a two-factor cross. These are the same basic grid principles students use today.
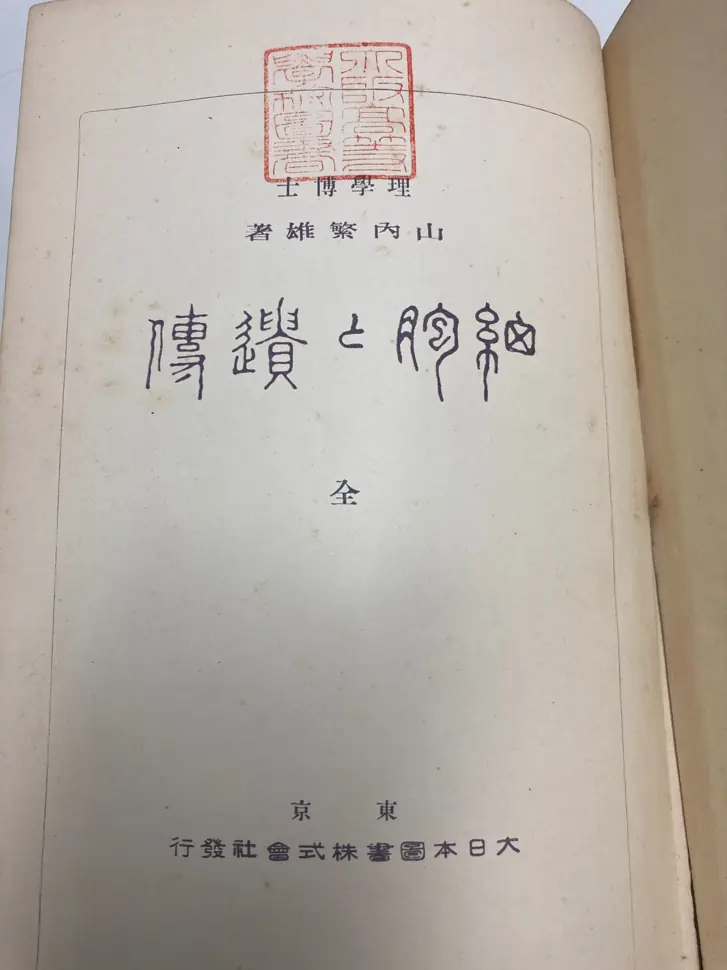
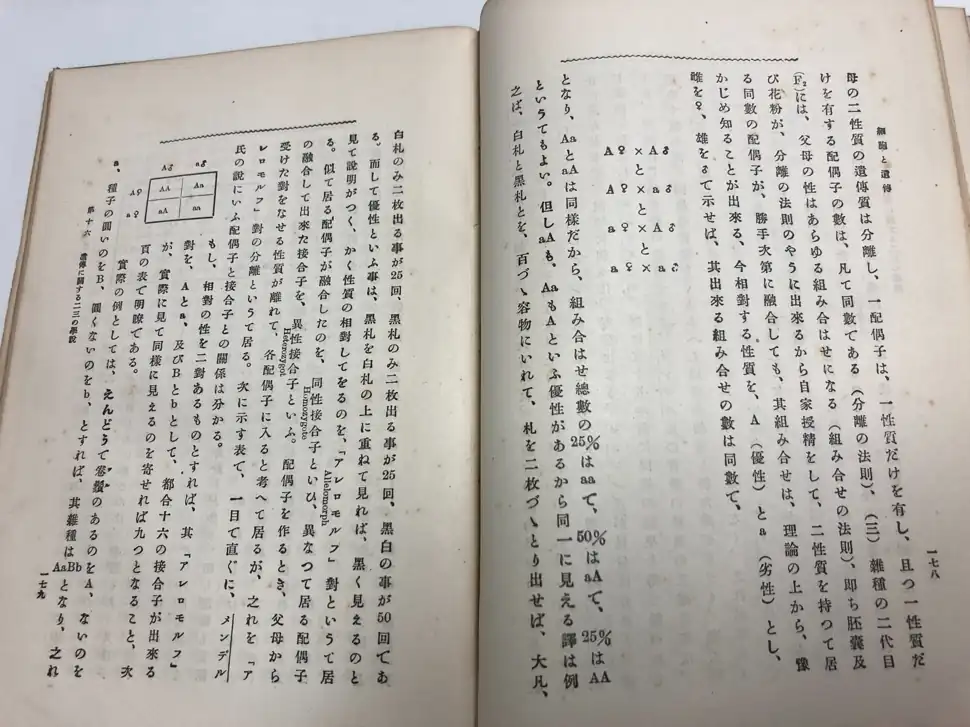
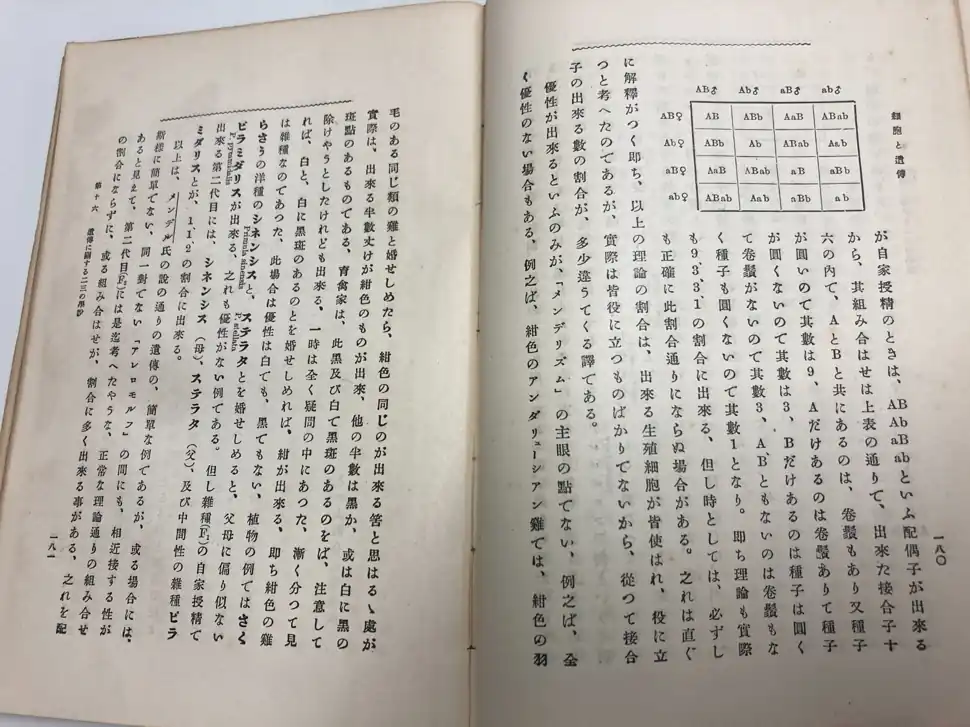
These photographs show that numerical genetics was being taught in Japanese well before the molecular structure of DNA was described in 1953. That does not mean genetic mechanisms were completely understood in 1914: the molecular identity and workings of hereditary material were still being established.
Who Was Gregor Mendel?
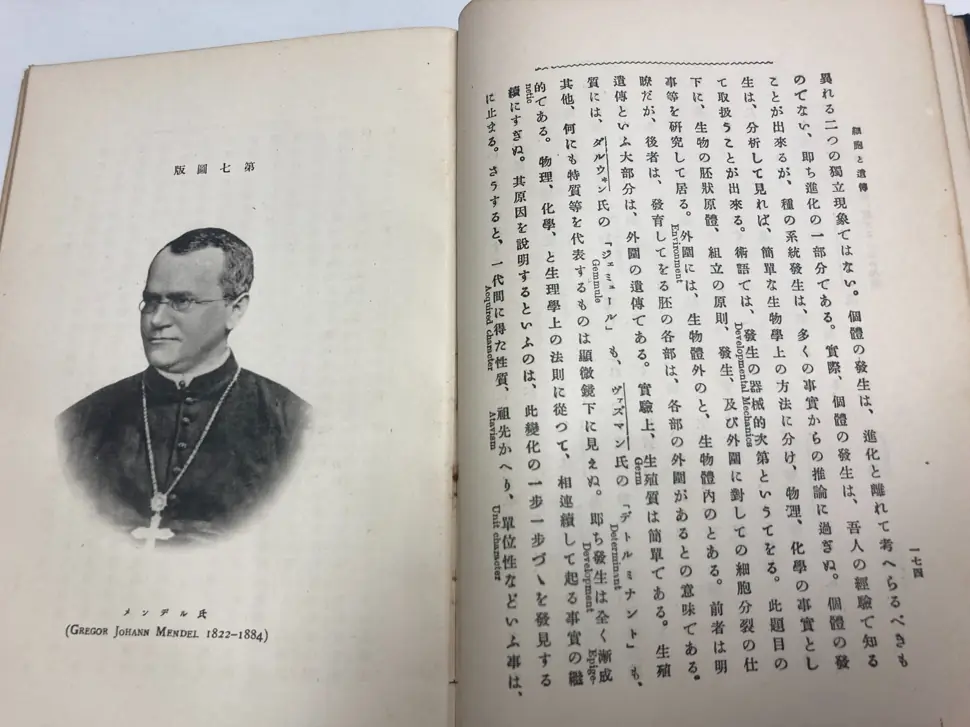
Gregor Mendel described consistent inheritance patterns through pea-plant crosses in work published in 1866. His findings were brought back to wide scientific attention around 1900. The historical textbook includes a portrait of Mendel, showing how quickly his work became part of early twentieth-century genetics education.
Common Punnett Square Mistakes
Mixing up genotype and phenotype: Aa and AA are different genotypes, but may have the same phenotype under complete dominance.
Reading probabilities as guarantees: A 25% probability does not mean exactly one in every four children must show that genotype.
Applying 9:3:3:1 to linked genes: The classic dihybrid ratio requires independent assortment and other simplifying assumptions.
Assuming all human traits are single-gene: Many characteristics are polygenic and influenced by the environment; simple Punnett squares are not appropriate for predicting them precisely.
Frequently Asked Questions
How do you calculate a Punnett square?
List each parent's possible gametes, combine them in a grid, and divide the number of each offspring genotype by the total number of equally likely boxes. If gamete probabilities differ, a weighted calculation is needed.
What does a 25% chance mean in a Punnett square?
Each offspring has a 1-in-4 probability of the specified genotype in the model. It does not impose a fixed ratio on a small number of births.
What is the difference between monohybrid and dihybrid crosses?
A monohybrid cross considers one gene; a dihybrid cross considers two genes. For independently assorting heterozygous parents, the corresponding grids are commonly 2×2 and 4×4.
Is the Punnett square always accurate?
It is accurate for the assumptions specified. Incomplete dominance, linkage, segregation distortion, and complex traits require additional modeling.
Can you use a Punnett square for human eye color?
Not as a reliable one-gene predictor. Human eye color is influenced by multiple genetic variants, so common one-gene examples are oversimplified.
Study More Genetics and Molecular Biology
Explore the DNA and RNA Structure Quiz to practice recognizing the molecules involved in heredity, and visit 20 Amino Acids Structure Quiz for related biology study.
Sources and Historical Note
Historical source: Shigeo Yamauchi, Saibō to Iden (細胞と遺傳), Dai Nippon Tosho, originally published 1914; photographs from the 1922 seventh edition. Modern background: NHGRI Genetics Glossary: Mendelian Inheritance. All historical images are photographs of the original printed copy.